Authors:
(1) Guillaume Staerman, INRIA, CEA, Univ. Paris-Saclay, France;
(2) Marta Campi, CERIAH, Institut de l’Audition, Institut Pasteur, France;
(3) Gareth W. Peters, Department of Statistics & Applied Probability, University of California Santa Barbara, USA.
Table of Links
2.1. Functional Isolation Forest
3. Signature Isolation Forest Method
4.1. Parameters Sensitivity Analysis
4.2. Advantages of (K-)SIF over FIF
4.3. Real-data Anomaly Detection Benchmark
5. Discussion & Conclusion, Impact Statements, and References
Appendix
A. Additional Information About the Signature
C. Additional Numerical Experiments
4.2. Advantages of (K-)SIF over FIF
This part highlights the advantages of our class of algorithms over Functional Isolation Forest. We provide numerical experiments supporting our approach’s appealing properties, such as the robustness to noisy data and detecting order variation changes.
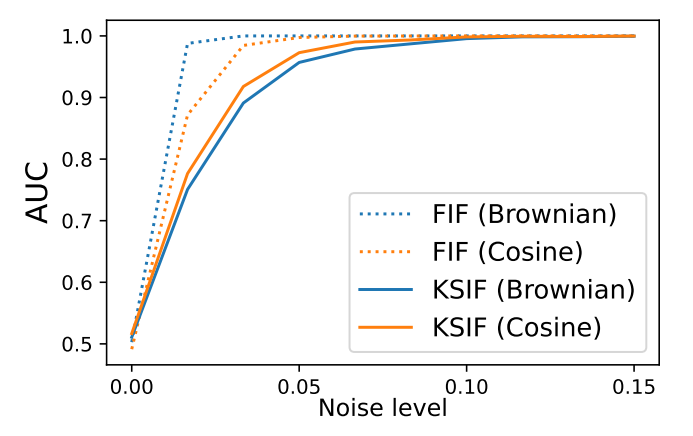
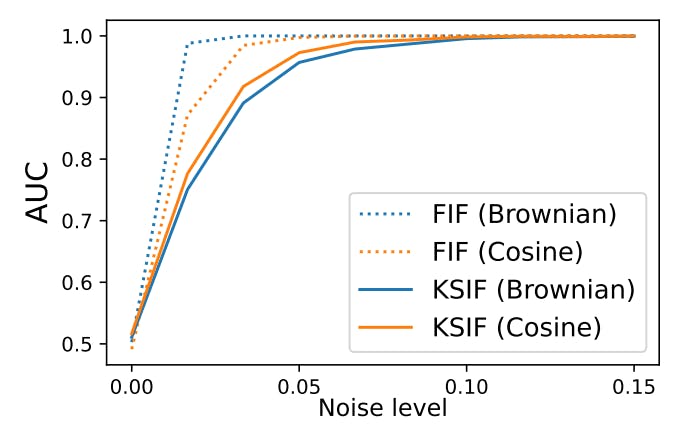
Robustness to Noise. We now explore the sensitivity of our class of algorithms to noisy data. We also provide a comparison with Functional Isolation Forest. To that end, we simulate a dataset of 500 ‘relatively smooth’ standard Brownian motion paths with µ = 0 and σ = 0.05. We also simulate 50 standard Brownian motion paths with µ = 0 and σ ∈ [0.05, 0.2]. Depending on the level of noise present in the last 50 curves (i.e., standard deviation here), these paths may represent normal, noisy and abnormal data. For example, 0.05 (corresponding to 0 noise level) is normal data, while 0.2 (corresponding to 0.15 noise level) is abnormal.
We perform K-SIF and FIF with both ‘Brownian’ and ‘Cosine’ dictionaries and report the AUC under the ROC curves by considering the 50 curves as the second class in Figure 2.
An AUC of 1 means that the 50 curves of the second class are identified as anomalies, while an AUC of 0.5 indicates that the algorithm cannot distinguish them from normal data. According to the findings provided in Section 4.1, the parameters for K-SIF have been chosen such that the number of split window sizes is equal to 10 while the depth of the signature k = 2. We can observe that FIF, regardless of the dictionary used, is highly sensitive to noisy data and considers it abnormal, even with a minimal noise level. In contrast, K-SIF is way more robust to such data and requires higher noise levels to start viewing this data as anomalies.

(K-)SIF detects Swap Order Variation Changes. The signature method considers the order of occurring events in functional data. To investigate this phenomenon with our proposed class of algorithms, we define a synthetic dataset of 100 smooth functions given by

with t ∈ [0, 1] and q equispaced in [1, 1.4]. Then, we simulate the occurrences of events by adding Gaussian noise on different portions of the functions. We randomly select 90% of them and add Gaussian values on a sub-interval, i.e.,

where ε(t) ∼ N (0, 0.8). We consider the 10% remaining as abnormal by adding the same ‘events’ on another subinterval compared to the first one, i.e.,

where ε(t) ∼ N (0, 0.8). See Figure 8 in the Appendix for a dataset visualization. To summarize, we have constructed two identical events occurring at different parts of the functions, leading to isolating anomalies. As presented in the introduction, this class of anomalous data are amongst the most challenging to identify.
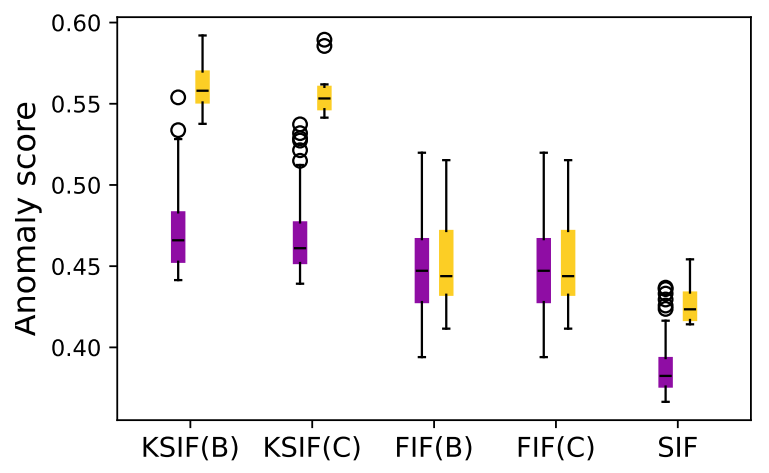
We compute SIF, K-SIF and FIF with Brownian and Cosine dictionaries on these simulated datasets. As indicated in Section 4.1, for (K-)SIF, we choose ω = 10, the number of split windows, and k = 2, the depth of the signature. In Figure 3, we report boxplots of the anomaly score returned by the algorithms for the normal data in purple and abnormal data in yellow. While this could appear a very simple task, in practice, it is highly challenging for an AD algorithm to differentiate such classes of curves. The introduction of the signature method should tackle precisely this type of scenario, since taking into account the order of the events.

Using both dictionaries, FIF fails to detect this anomaly as it is not designed to handle these type of phenomena. In contrast, K-SIF and SIF produce significantly distinguished scores between normal and abnormal data, efficiently classifying the second data class as anomaly.
This paper is available on arxiv under CC BY 4.0 DEED license.

